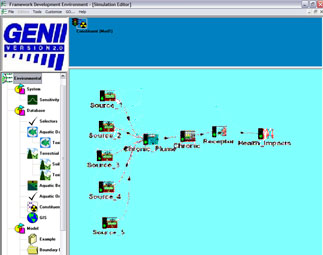

The Conceptual Site Model (CSM) is the picture that represents the scope of the assessment. It resembles a flow diagram. FRAMES allows you to build this flow diagram using icons that represent pieces of the real world. This section covers selecting icons from the palette, located on the left side of the workspace, and drawing connections between icons to represent relationships. It also provides an example case with an associated CSM example.
The following animated/narrated tutorial section summarizes selecting and connecting modules. Additionally, this animated tutorial also covers the material in the next two sections.
The CSM shown below consists of a site with 5 co-located emission points of varying characteristics, emitting radioactive contamination. The ambient temperature is assumed to average 10 degrees celsius. No nearby buildings contribute to building wake effects.

The basic conceptual model for this case is illustrated. Five sources are feeding the GENII chronic, annual average Gaussian plume atmospheric transport model. (This model is preferred because the available data for this location exist in the form of a STAR file, not hourly data.) The resulting concentrations and deposition rates of the released radionuclides are used in the GENII chronic exposure module to estimate accumulation in the soil, farm products, and other media to which people could be exposed. Individual exposures to these contaminated media are modeled with the GENII receptor intake module. The GENII health impacts module is used to estimate the radiation doses and risks to the people living around the release point.


 FRAMES Tutorial Home | Security & Privacy | Contact Us