![]() 4.0 Scenarios
4.0 Scenarios
4.1 Life Stages
4.2 Scenario 1
Model Flow Diagram 1
4.3 Scenario 2
Model Flow Diagram 2
4.4 Scenario 3
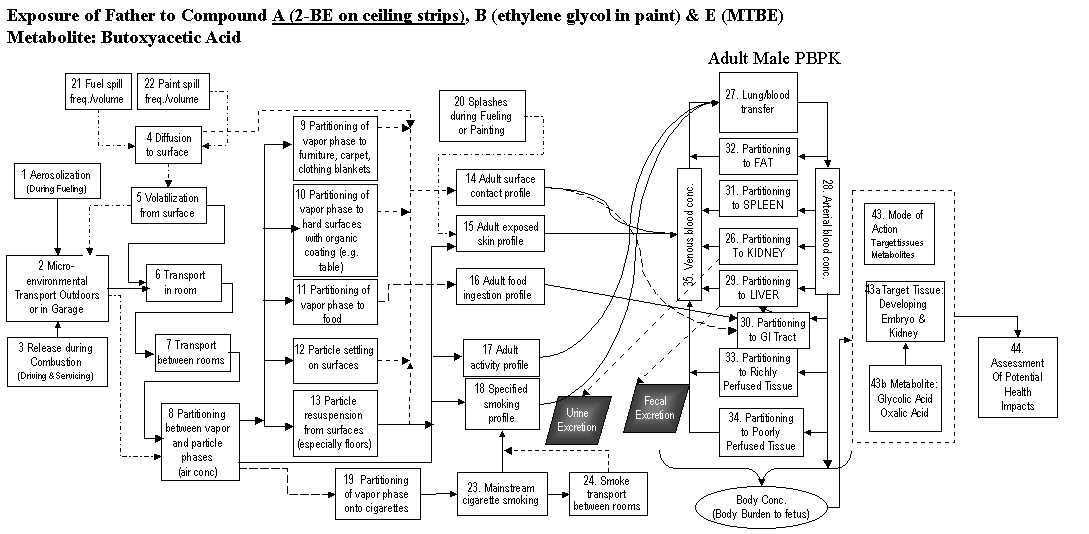
Model Flow Diagram 3
4.5 Scenario 4
Model Flow Diagram 4
4.6 Process Flow
4.7 Gap Analysis
the mapping between the models and the process numbers.
Select a model or model description from the table below (ordered alphabetically),
and the corresponding processes on the diagram will be highlighted.
Notes
- Compound A: 2-BE
- Metabolite: butoxyacetic acid (primary), butoxyethanol glucuronide, butoxyethanol sulfate
- Mode of Action: liver and spleen
- Mode of Action: Bone Marrow
- Data gaps: No models for #1 aerosolization of contaminant during fueling, #3 release of contaminant from internal combustion engine, #8 partitioning between vapor and particle phase, #13 particle resuspension from surfaces (especially floors), #20 splashes during fueling or painting, #21 Fuel spill frequency/volume, #22 Paint spill frequency/volume, or #23 Mainstream smoking (may be able to use something from review article on smoking release from website http://ehpnet1.niehs.nih.gov/docs/1999/Suppl-2/375-381ott/abstract.html)
- Dr. John Little and others at Virginia Tech in Blacksburg, VA have developed diffusion algorithms for VOCs that may be an improvement over existing models for diffusion-controlled release in process #1 and the reversible, diffusive sink effect for processes #6, #7, & #8. Papers describing these algorithms have recently been accepted in the journals "Indoor Air" and " Environmental Science & Technology". Dr. Little's e-mail address is jcl@vt.edu.
Return to Process Framework list.

